Determining Nitrogen Rates for Stressed Wheat
go.ncsu.edu/readext?344403
en Español / em Português
El inglés es el idioma de control de esta página. En la medida en que haya algún conflicto entre la traducción al inglés y la traducción, el inglés prevalece.
Al hacer clic en el enlace de traducción se activa un servicio de traducción gratuito para convertir la página al español. Al igual que con cualquier traducción por Internet, la conversión no es sensible al contexto y puede que no traduzca el texto en su significado original. NC State Extension no garantiza la exactitud del texto traducido. Por favor, tenga en cuenta que algunas aplicaciones y/o servicios pueden no funcionar como se espera cuando se traducen.
Português
Inglês é o idioma de controle desta página. Na medida que haja algum conflito entre o texto original em Inglês e a tradução, o Inglês prevalece.
Ao clicar no link de tradução, um serviço gratuito de tradução será ativado para converter a página para o Português. Como em qualquer tradução pela internet, a conversão não é sensivel ao contexto e pode não ocorrer a tradução para o significado orginal. O serviço de Extensão da Carolina do Norte (NC State Extension) não garante a exatidão do texto traduzido. Por favor, observe que algumas funções ou serviços podem não funcionar como esperado após a tradução.
English
English is the controlling language of this page. To the extent there is any conflict between the English text and the translation, English controls.
Clicking on the translation link activates a free translation service to convert the page to Spanish. As with any Internet translation, the conversion is not context-sensitive and may not translate the text to its original meaning. NC State Extension does not guarantee the accuracy of the translated text. Please note that some applications and/or services may not function as expected when translated.
Collapse ▲One of the primary determining factors for spring applied nitrogen (N) rate determination is the number of healthy tillers (no disease or insect infestation) per square foot. Personal experience and historical field yield are also important considerations, but a low tillers count means low potential head development. Other factors such as head size and grain weight will influence final yield but these cannot be managed at the time of N application and will be determined by varietal differences and climatic factors we cannot manage.
The first step in N management should be to determine the number of tillers per square foot. One way to do this is to simply make a square frame one foot wide and one foot long. Randomly place the frame within the field and count the number of tillers within the frame within several areas of the field. As an alternative, use the formula below. Remember to count only plants with at least three leaves as a tiller and sample several areas to get an accurate average.
Formula for Tiller Estimation
Tillers per square foot = (tillers per yard of row) × 4 ÷ (row width in inches)
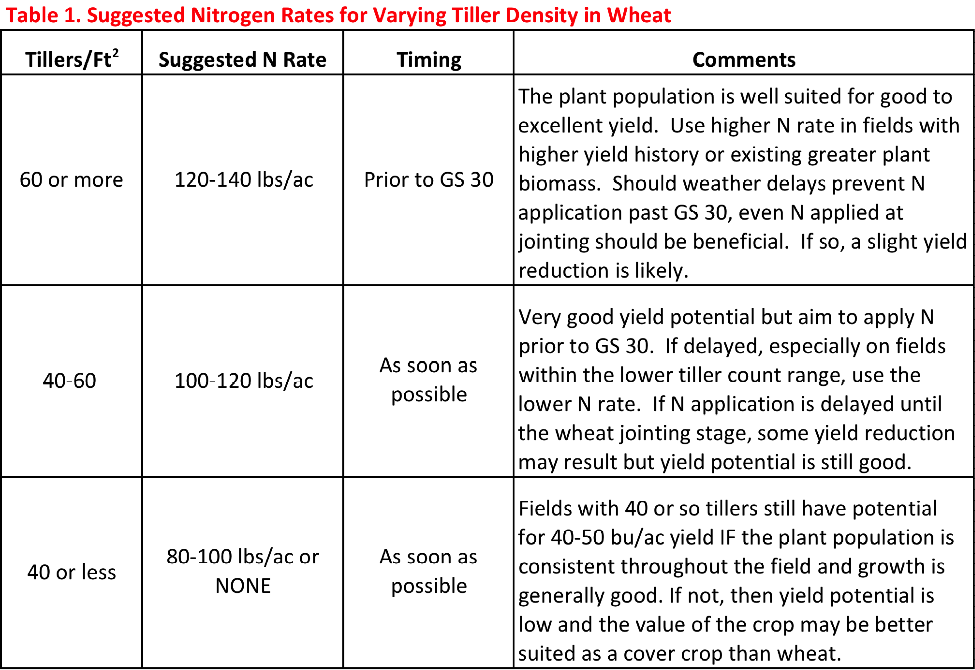
Once the number of tillers is determined, use the chart below as a guide for nitrogen rates.
It should be noted that any N applications is likely to be delayed further based upon the weather outlook over the next weeks and current field conditions. This is not as critical as normal simply because the crop is also delayed about 10 days or so. If continued wet soils delay application past GS 30 but prior to jointing, N applications are likely to burn leaves but still be beneficial. Some yield reduction can be expected simply due to the high demand of N within the plant at this growth stage and the delay in getting the N to the plant.
While the chart provides some guidance regarding fields with some consistency in tillers per square foot, it will not provide much guidance for those with inconsistent plant populations. In this circumstance, personal experience and willingness to accept risks will determine management.
Please consider taking leaf samples for nutrient analysis shortly after N application by submitting leaf tissue to the NCDA & CS Agronomic Division. Other nutrients, especially sulfur, manganese and copper have commonly been identified as deficient nutrients of wheat grown within Craven County. Don’t negate the time, effort and good decisions made to determine the correct N rate by limiting yield from a deficiency of some other nutrient! The crop is delayed but still has excellent yield potential. Remember, we can manage nutrient concentration of the wheat. We cannot manage the weather.
Additional information can be found at the NC State Extension Small Grains website.
Pertinent Videos
- Jacob Morgan, NC State Extension Agent in Jones County, created a very good video (about 2.5 minutes) showing how to count tillers (using a slightly different method that posted here) at https://www.youtube.com/watch?v=2wZ5_1VgLig
- Jacob Morgan, NC State Extension Agent in Jones County, and Chris Jernigan, NCDA & CS Regional Agronomist, posted an excellent video (2 minutes) outlining early season nutrient deficiencies at https://www.youtube.com/watch?v=jsCbC9J-Nj8
Email me at: mike_carroll@ncsu.edu


